
 Sign in
20160202 Gaia Alerts back in action - Gaia
Gaia Alerting Again |
||
|
The Gaia Photometric Science Alerts Pipeline is back in action! The Alerts team is once again running routine detection of transient sources as Gaia scans the sky. 36 new alerts have already been published since mid-January. |
||
 |
||
|
|
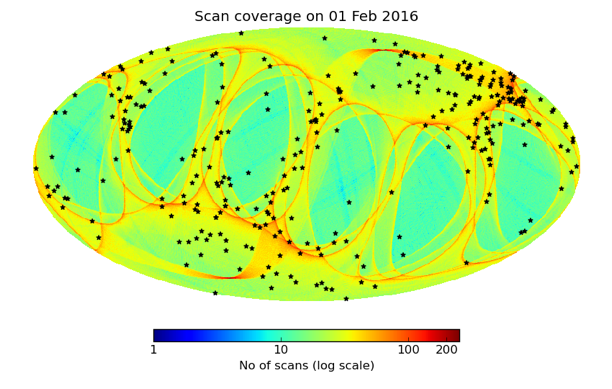
Figure 1: The map shows locations of Gaia Science Alerts published since 13 October 2014 (black stars), superimposed on the scan density map of the sky. The background colour indicates how many times each area, of approximately 0.05 square degrees, of the sky was seen by the Gaia Photometric Science Alerts. The map is shown in the equatorial coordinate system. | |
| The photometric alerts pipeline was taken offline last summer at the end of its commissioning phase. The team published 273 alerts in 9 months of operation, and classified 40% of the alerts (including 74 Supernovae). This exercise helped to dramatically reduce the numbers of false alarms found by the automated detection and classification codes. | ||
 |
||
|
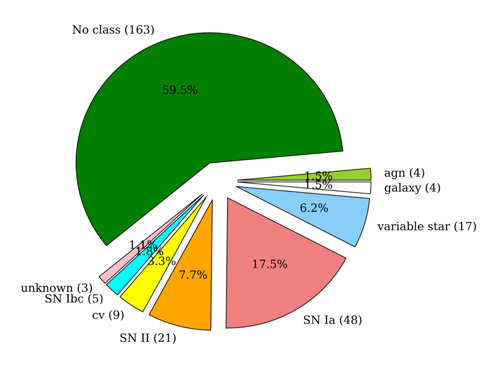
Figure 2: Classification of Gaia published photometric science alerts. For 40% of the transients the team was able to obtain follow-up data and classify their nature. For 60% no follow-up data were obtained. This figure is reproduced from N. Blagorodnova's PhD thesis. |
||
|
While the pipeline was offline, the interface to the published alerts was updated and improved. Users can now investigate the spectra and lightcurves of each published alert (including those published in the past). All alerts continue to be updated with data from Gaia, and classification from follow-up. |
||
| [published: 02/02/2016] | ||
- Removed a total of (8) style text-align:center;
- Removed a total of (6) style text-align:justify;
- Removed a total of (1) border attribute.
- Removed a total of (1) cellpadding attribute.
- Removed a total of (1) cellspacing attribute.