Image of the Week


An alternative Gaia sky chart


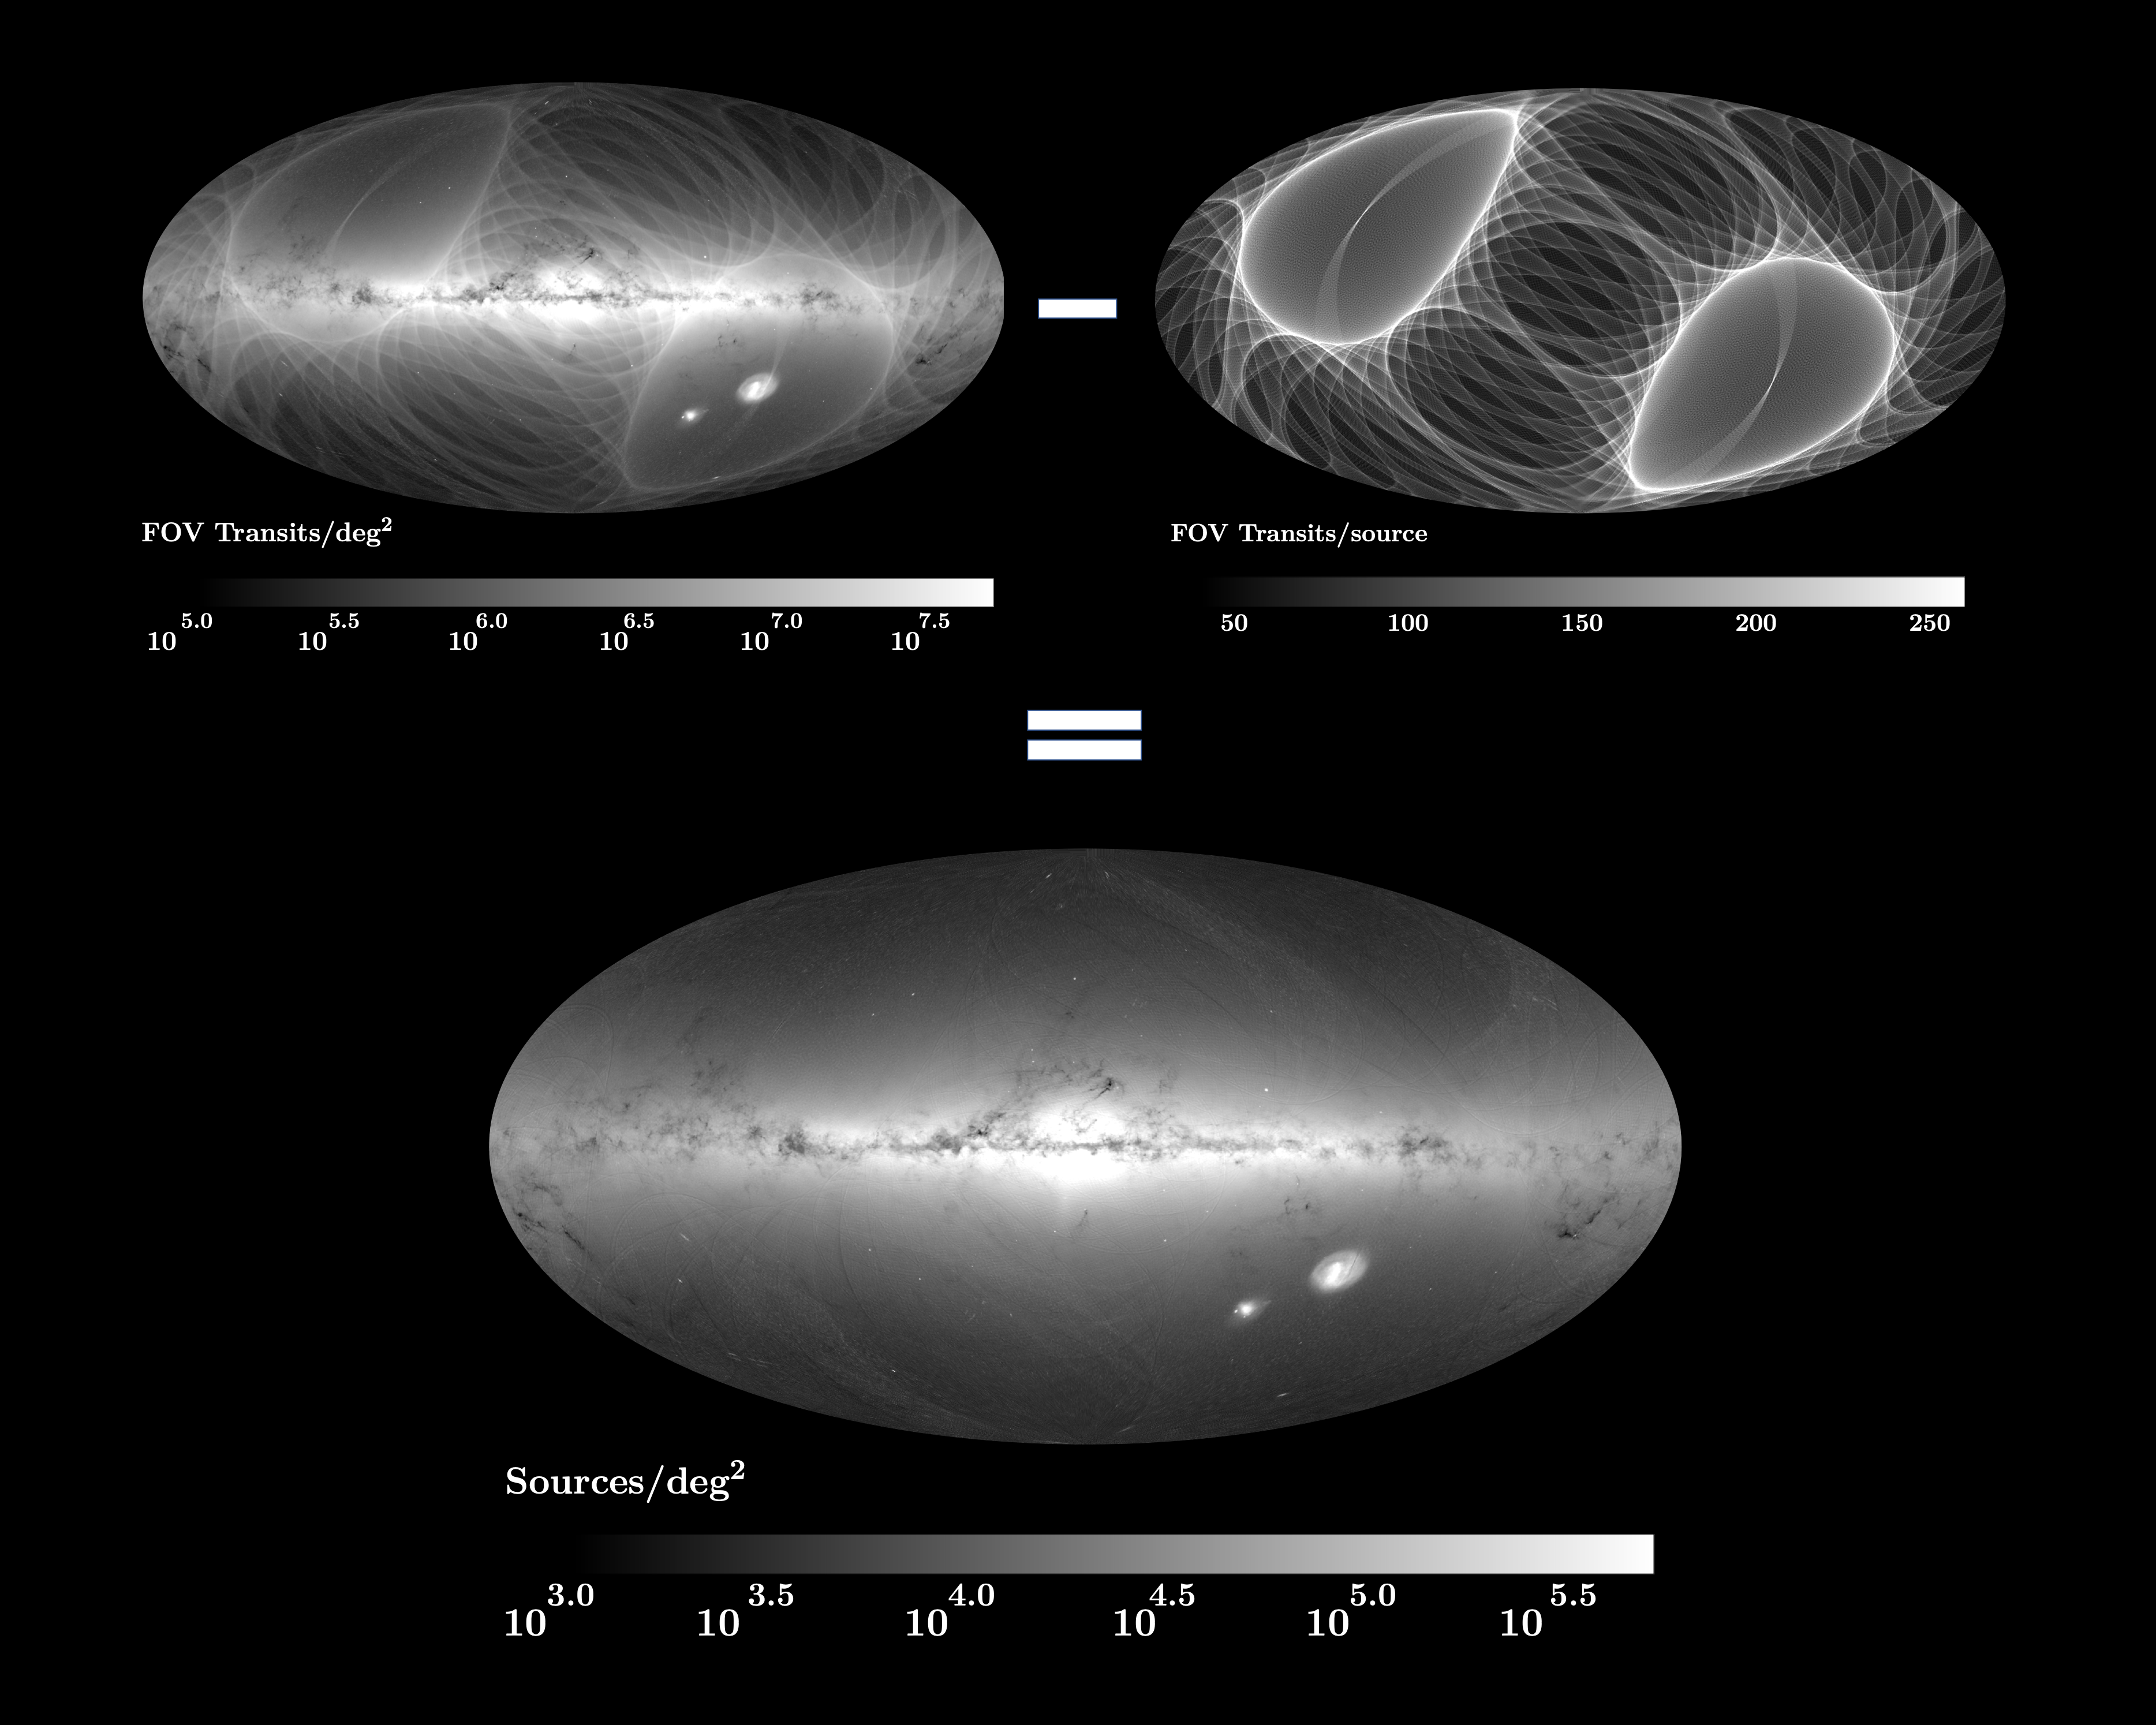
The three plots show an all-sky Hammer-Aitoff projection in galactic coordinates giving respectively : top left : the number of transits per square degree detected with Gaia in seven years (August 2014 to July 2021). In total 170 billion detections have been summed up to generate this plot, resulting in a realistic picture of how the raw data is distributed. top right : the number of observations per source computed with the Gaia scanning law over the same seven years, showing the highest coverage at 45 degree of ecliptic latitude, and the slight trace of the initial scan through the ecliptic poles. bottom : the raw data corrected for the bias due to the scanning law pattern, expressed as the number of sources per square degree. This is a sky-map, but produced without plotting stars.


Everyone working in the DPAC or using the Gaia results knows how much mathematic modelling and computer science take place behind the stage to transform the dull raw material delivered by the telescopes into an incredible epoch-making catalogue.  In this story one shows that with only simple arithmetic, repeated additions (admittedly nearly 180 billion!) and a bunch of divisions one can already tell how many stars Gaia sees, and map the sky with a surprising and exquisite level of detail, hardly discernible from a map computed from the full catalogue. This is made possible by charting the daily on-board detections corrected for the uneven pointings brought about by the scanning law.

The scanning law of Gaia stands for the way the different directions of sky are explored as a function of time. Gaia is not like the Hubble Space Telescope, for example, a pointing instrument directed to a particular area of the sky to collect the light over long exposures to integrate more photons. Gaia, like its predecessor Hipparcos, is a scanning satellite, constantly in motion with no way to adjust the exposure to the source brightness. Thus, over the time, Gaia instruments sweep a great circle of the celestial sphere whose orientation is slowly altered in such a way that after a few months the whole sky has been visited.  This is repeated year after year, but never identically. Sources are then detected repeatedly with a rather irregular time sampling, but typically a new visit occurs every two months with large variations about this mean. At the end, the number of detections in a particular direction is a complex combination between the actual stellar density on the sky and the number of times the Gaia pointing has passed over this region.

The Gaia continuous scanning amounts to 70 million detections per day on average resulting in more than 170 billion over seven years, a huge, huge number. Each detection is given a unique identifier encoding the approximate position, the magnitude, the field of view and the date at which this has been recorded to micro-second accuracy. This is stored in computer files, typically one every day, that are the main input of the Gaia cyclic processing. Here I read these files in sequence to count and locate the detected sources and eventually visualise the numbers with maps instead of spreadsheets. The vast majority of the detections correspond to stars in the Milky Way.  But there are also the moving sources from the solar system (removed in this selection) and a few millions of extragalactic sources. There is also a fraction of spurious detections that are identified later in the processing and deleted from the data but not removed in this map.

The upper-left image is a density map of the 170 billion raw detections, over a period of seven years, from the start of the scientific mission in July 2014 until 30 July 2021. The detections are added one by one in counters, one per map pixel. There are about 3 million pixels in the map, leading to an average of 55,000 detections per pixel, with large variations from place to place.  Given the pixel size this gives an average density of 4 million detections per square degree as shown in the scale below the map. The scale shows also the extent of the variation between 100,000 to almost 100 million detections per unit area. The map shows that the number of detections is a combination between the number of sources per square degree in a particular direction, primarily determined by the galactic latitude, and the number of observations per unit of time allowed by the Gaia scanning law. The two features are nicely entangled in this map as though one had superimposed the sky coverage map from the Gaia scanning over an astronomical sky map. But this is not the case, each density is exactly what one has in the Gaia raw data. This map is very similar to the image of the week of 26 February 2021 constructed during the IDU filtering on the cycle 4 data.

Would it be possible to remove the scanning law loops which look like a foreground or a watermark blurring the Milky Way? Well, this is not really a foreground, but just a complex density map combining two effects resulting in this density distribution. However, the Gaia scanning law is perfectly known, as is the satellite attitude over the seven years of operation.

The actual coverage is shown in the upper-right map giving the expected number of times the Gaia FOVs should go through every direction over exactly the same period of time. This is a well known plot shown here in galactic coordinates, with the ecliptic poles near the centres of the small circles at 45 degrees of ecliptic latitude. On can see the graceful imprint of the peculiar scanning (perpendicular to ecliptic and visiting the ecliptic poles every six hours) during the first month of the mission in August 2014. The area around these two small circles are the most frequently visited by the Gaia telescopes, while the ecliptic plane is under-observed. All the details of the scanning loops are visible with some attenuation in the first density map.

By weighing the detection density by the inverse of the number of FOV crossings, one should largely reduce the visible structures coming from the scanning law and come nearer to a true celestial map, corrected for the bias brought about by the irregularities of the sky coverage. This was what I hoped when starting this project, but this went way beyond my wildest expectations.

The result is displayed in the lower map, given now a quantity that it is reasonable to label as "number of sources per square degree", although no match has been used to associate repeated detections to unique sources and no sources have been counted. The map is almost free of any remaining pattern from the scanning law, but the large area in the high galactic latitude with lower density, clearly related to loop of the second map at the same location. With this crude count one finds 37,500 stars per square degree equivalent to a full catalogue of 1.6 billion stars. This underestimates a little the true content of the Gaia catalogue because the scaling factor used to normalise the scanning law does not include any dead time, uses a full efficient FOV and is a bit too optimistic.

One can zoom a little in this 'deconvolved map' to discover many nearly dot-like features corresponding to galaxies and globular clusters (Andromeda in the lower left, Omega Centauri right above the galactic plane slightly right off the centre), large enough to be seen as peculiar concentrations of sources, reminiscent of the sky map released with the Gaia DR1 and built with the Gaia catalogue of detected sources matched to the observations. The way any sensible astronomer would think as the only mean to generate an all-sky map. An elder sister of this image appeared also in July 2015 from the on-board counting of stars used for the attitude-control loop, every second of Gaia life. Same overall idea, very different data.

This is remarkable that such a detailed celestial map can be constructed just by counting detections and applying the proper weight to remove almost perfectly the very large irregularities produced by the scanning law. No sophisticated astronomy or mathematics is involved and it could have been proposed as a student term project once he has been given a routine or a table to get the scan pointing at any time. One just needs to handle large data sets, surely a skill that must be learnt.


Credits: F. Mignard, University Côte d'Azur, Observatory of the Côte d'Azur. Thanks to the Gaia web service maintained by CNES in DPCC for making accessible the Gaia detection records on a regular basis for DPAC and to Laurent Galluccio for the smooth extractions into customized smaller files.

Published: 16/09/2021


Image of the Week Archive

2023

19/12: 10 Science topics to celebrate Gaia's 10 years in space

31/10: Gaia observes cosmic clock inside a heavenly jewel

10/10: Gaia Focused Product Release stories

27/09: Does the Milky Way contain less dark matter than previously thought?

22/09: Mass-luminosity relation from Gaia's binary stars

13/09: Gaia DPAC CU8 seminars

13/06: Gaia's multi-dimensional Milky Way

18/05: Mapping the Milky Way

15/05: Goonhilly station steps in to save Gaia science data

25/04: The Gaia ESA Archive

05/04: Dual quasar found to be hosted by an ongoing galaxy merger at redshift 2.17

21/03: GaiaVari: a citizen science project to help Gaia variability classificaton

09/02: Missing mass in Albireo Ac: massive star or black hole?

31/01: Gaia reaches to the clouds – 3D kinematics of the LMC

25/01: Meet your neighbours: CNS5 - the fifth catalogue of nearby stars

18/01: A single-object visualisation tool for Gaia objects

2022

25/11: 100 months of Gaia data

23/11: The astonishment

09/11: Gamma-Ray Burst detection from Lagrange 2 point by Gaia

04/11: Gaia's first black hole discovery: Gaia BH1

26/10: Are Newton and Einstein in error after all?

21/10: Gaia ESA Archive goes live with third data release

06/10: Mapping the interstellar medium using the Gaia RVS spectra

26/09: Gaia on the hunt for dual quasars and gravitational lenses

23/09: Gaia's observation of relativistic deflection of light close to Jupiter

13/06: Gaia Data Release 3

10/06: MK classification of stars from BP/RP spectrophotometry across the Hertzsprung-Russell diagram

09/06: BP/RP low-resolution spectroscopy across the Hertzsprung-Russell diagram

27/05: Cepheids and their radial velocity curves

23/05: The Galaxy in your preferred colours

19/05: GaiaXPy 1.0.0 released, a tool for Gaia's BP/RP spectra users

11/05: Systemic proper motions of 73 galaxies in the Local group

28/03: Gaia query statistics

16/03: Gaia's first photo shooting of the James Webb Space Telescope

08/03: Gaia's women in science - coordination unit 8

25/02: Not only distances: what Gaia DR3 RR Lyrae stars will tell us about our Galaxy and beyond

11/02: Gaia's women in science

31/01: Astrometric orbit of the exoplanet-host star HD81040

12/01: The Local Bubble - source of our nearby stars

05/01: A Milky-Way relic of the formation of the Universe

2021

23/12: Signal-to-Noise ratio for Gaia DR3 BP/RP mean spectra

22/12: The 7 October 2021 stellar occultation by the Neptunian system

01/12: Observation of a long-predicted new type of binary star

24/09: Astrometric microlensing effect in the Gaia16aye event

22/09: the power of the third dimension - the discovery of a gigantic cavity in space

16/09: An alternative Gaia sky chart

25/08: Gaia Photometric Science Alerts and Gravitational Wave Triggers

09/07: How Gaia unveils what stars are made of

23/06: Interviews with CU3

27/04: HIP 70674 Orbital solution resulting from Gaia DR3 processing

30/03: First transiting exoplanet by Gaia

26/03: Apophis' Yarkovsky acceleration improved through stellar occultation

26/02: Matching observations to sources for Gaia DR4

2020

22/12: QSO emission lines in low-resolution BP/RP spectra

03/12: Gaia Early Data Release 3

29/10: Gaia EDR3 passbands

15/10: Star clusters are only the tip of the iceberg

04/09: Discovery of a year long superoutburst in a white dwarf binary

12/08: First calibrated XP spectra

22/07: Gaia and the size of the Solar System

16/07: Testing CDM and geometry-driven Milky Way rotation Curve Models

30/06: Gaia's impact on Solar system science

14/05: Machine-learning techniques reveal hundreds of open clusters in Gaia data

20/03: The chemical trace of Galactic stellar populations as seen by Gaia

09/01: Discovery of a new star cluster: Price-Whelan1

08/01: Largest ever seen gaseous structure in our Galaxy

2019
20/12: The lost stars of the Hyades
06/12: Do we see a dark-matter like effect in globular clusters?
12/11: Hypervelocity star ejected from a supermassive black hole
17/09: Instrument Development Award
08/08: 30th anniversary of Hipparcos
17/07: Whitehead Eclipse Avoidance Manoeuvre
28/06: Following up on Gaia Solar System Objects
19/06: News from the Gaia Archive
29/05: Spectroscopic variability of emission lines stars with Gaia
24/05: Evidence of new magnetic transitions in late-type stars
03/05: Atmospheric dynamics of AGB stars revealed by Gaia
25/04: Geographic contributions to DPAC
22/04: omega Centauri's lost stars
18/04: 53rd ESLAB symposium "the Gaia universe"
18/02: A river of stars
2018
21/12: Sonification of Gaia data
18/12: Gaia captures a rare FU Ori outburst
12/12: Changes in the DPAC Executive
26/11:New Very Low Mass dwarfs in Gaia data
19/11: Hypervelocity White Dwarfs in Gaia data
15/11: Hunting evolved carbon stars with Gaia RP spectra
13/11: Gaia catches the movement of the tiny galaxies surrounding the Milky Way
06/11: Secrets of the "wild duck" cluster revealed
12/10: 25 years since the initial GAIA proposal
09/10: 3rd Gaia DPAC Consortium Meeting
30/09: A new panoramic sky map of the Milky Way's Stellar Streams
25/09: Plausible home stars for interstellar object 'Oumuamua
11/09: Impressions from the IAU General Assembly
30/06: Asteroids in Gaia Data
14/06: Mapping and visualising Gaia DR2

25/04: In-depth stories on Gaia DR2

14/04: Gaia tops one trillion observations
16/03: Gaia DR2 Passbands
27/02: Triton observation campaign
11/02: Gaia Women In Science
29/01: Following-up on Gaia
2017
19/12: 4th launch anniversary
24/11: Gaia-GOSA service
27/10: German Gaia stamp in the making
19/10: Hertzsprung-russell diagram using Gaia DR1
05/10: Updated prediction to the Triton occultation campaign
04/10: 1:1 Gaia model arrives at ESAC
31/08: Close stellar encounters from the first Gaia data release
16/08: Preliminary view of the Gaia sky in colour
07/07: Chariklo stellar occultation follow-up
24/04: Gaia reveals the composition of asteroids
20/04: Extra-galactic observations with Gaia
10/04: How faint are the faintest Gaia stars?
24/03: Pulsating stars to study Galactic structures
09/02: Known exoplanetary transits in Gaia data
31/01: Successful second DPAC Consortium Meeting
2016
23/12: Interactive and statistical visualisation of Gaia DR1 with vaex
16/12: Standard uncertainties for the photometric data (in GDR1)
25/11: Signature of the rotation of the galactic bar uncovered
15/11: Successful first DR1 Workshop
27/10: Microlensing Follow-Up
21/10: Asteroid Occultation
16/09: First DR1 results
14/09: Pluto Stellar Occultation
15/06: Happy Birthday, DPAC!
10/06: 1000th run of the Initial Data Treatment system
04/05: Complementing Gaia observations of the densest sky regions
22/04: A window to Gaia - the focal plane
05/04: Hipparcos interactive data access tool
24/03: Gaia spots a sunspot
29/02: Gaia sees exploding stars next door
11/02: A new heart for the Gaia Object Generator
04/02: Searching for solar siblings with Gaia
28/01: Globular cluster colour-magnitude diagrams
21/01: Gaia resolving power estimated with Pluto and Charon
12/01: 100th First-Look Weekly Report
06/01: Gaia intersects a Perseid meteoroid
2015
18/12: Tales of two clusters retold by Gaia
11/11: Lunar transit temperature plots
06/11: Gaia's sensors scan a lunar transit
03/11: Celebrity comet spotted among Gaia's stars
09/10: The SB2 stars as seen by Gaia's RVS
02/10: The colour of Gaia's eyes
24/09: Estimating distances from parallaxes
18/09: Gaia orbit reconstruction
31/07: Asteroids all around
17/07: Gaia satellite and amateur astronomers spot one in a billion star
03/07: Counting stars with Gaia
01/07: Avionics Model test bench arrives at ESOC
28/05: Short period/faint magnitude Cepheids in the Large Magellanic Cloud
19/05: Visualising Gaia Photometric Science Alerts
09/04: Gaia honours Einstein by observing his cross
02/04: 1 April - First Look Scientists play practical joke
05/03: RR Lyrae stars in the Large Magellanic Cloud as seen by Gaia
26/02: First Gaia BP/RP deblended spectra
19/02: 13 months of GBOT Gaia observations
12/02: Added Value Interface Portal for Gaia
04/02: Gaia's potential for the discovery of circumbinary planets
26/01: DIBs in three hot stars as seen by Gaia's RVS
15/01: The Tycho-Gaia Astrometric Solution
06/01: Close encounters of the stellar kind
2014
12/12: Gaia detects microlensing event
05/12: Cat's Eye Nebula as seen by Gaia
01/12: BFOSC observation of Gaia at L2
24/11: Gaia spectra of six stars
13/11: Omega Centauri as seen by Gaia
02/10: RVS Data Processing
12/09: Gaia discovers first supernova
04/08: Gaia flag arrives at ESAC
29/07: Gaia handover
15/07: Eclipsing binaries
03/07: Asteroids at the "photo finish"
19/06: Calibration image III - Messier 51
05/06: First Gaia BP/RP and RVS spectra
02/06: Sky coverage of Gaia during commissioning
03/04: Gaia source detection
21/02: Sky-background false detections in the sky mapper
14/02: Gaia calibration images II
06/02: Gaia calibration image I
28/01: Gaia telescope light path
17/01: First star shines for Gaia
14/01: Radiation Campaign #4
06/01: Asteroid detection by Gaia
2013
17/12: Gaia in the gantry
12/12: The sky in G magnitude
05/12: Pre-launch release of spectrophotometric standard stars
28/11: From one to one billion pixels
21/11: The Hipparcos all-sky map
15/10: Gaia Sunshield Deployment Test
08/10: Initial Gaia Source List
17/09: CU1 Operations Workshop
11/09: Apsis
26/08: Gaia arrival in French Guiana
20/08: Gaia cartoons
11/07: Model Soyuz Fregat video
01/07: Acoustic Testing
21/06: SOVT
03/06: CU4 meeting #15
04/04: DPCC (CNES) 
26/03: Gaia artist impression 
11/02: Gaia payload testing  
04/01: Space flyby with Gaia-like data
2012
10/12: DPAC OR#2. Testing with Planck
05/11: Galaxy detection with Gaia
09/10: Plot of part of the GUMS-10 catalogue
23/07: "Gaia" meets at Gaia
29/06: The Sky as seen by Gaia
31/05: Panorama of BAM clean room
29/03: GREAT school results
12/03: Scanning-law movie
21/02: Astrometric microlensing and Gaia
03/02: BAM with PMTS
12/01: FPA with all the CCDs and WFSs
2011
14/12: Deployable sunshield
10/11: Earth Trojan search
21/10: First Soyuz liftoff from the French Guiana
20/09: Fast 2D image reconstruction algorithm
05/09: RVS OMA
10/08: 3D distribution of the Gaia catalogue
13/07: Dynamical Attitude Model
22/06: Gaia's view of open clusters
27/05: Accuracy of the stellar transverse velocity
13/05: Vibration test of BAM mirrors
18/04: L. Lindegren, Dr. Honoris Causa of the Observatory of Paris
19/01: Detectability of stars close to Jupiter
05/01: Delivery of the WFS flight models
2010
21/12: The 100th member of CU3
17/11: Nano-JASMINE and AGIS
27/10: Eclipsing binary light curves fitted with DPAC code
13/10: Gaia broad band photometry
28/09: Measuring stellar parameters and interstellar extinction
14/09: M1 mirror
27/08: Quest for the Sun's siblings
 
Please note: Entries from the period 2003-2010 are available in this PDF document.