Image of the Week

Gaia tops one trillion observations


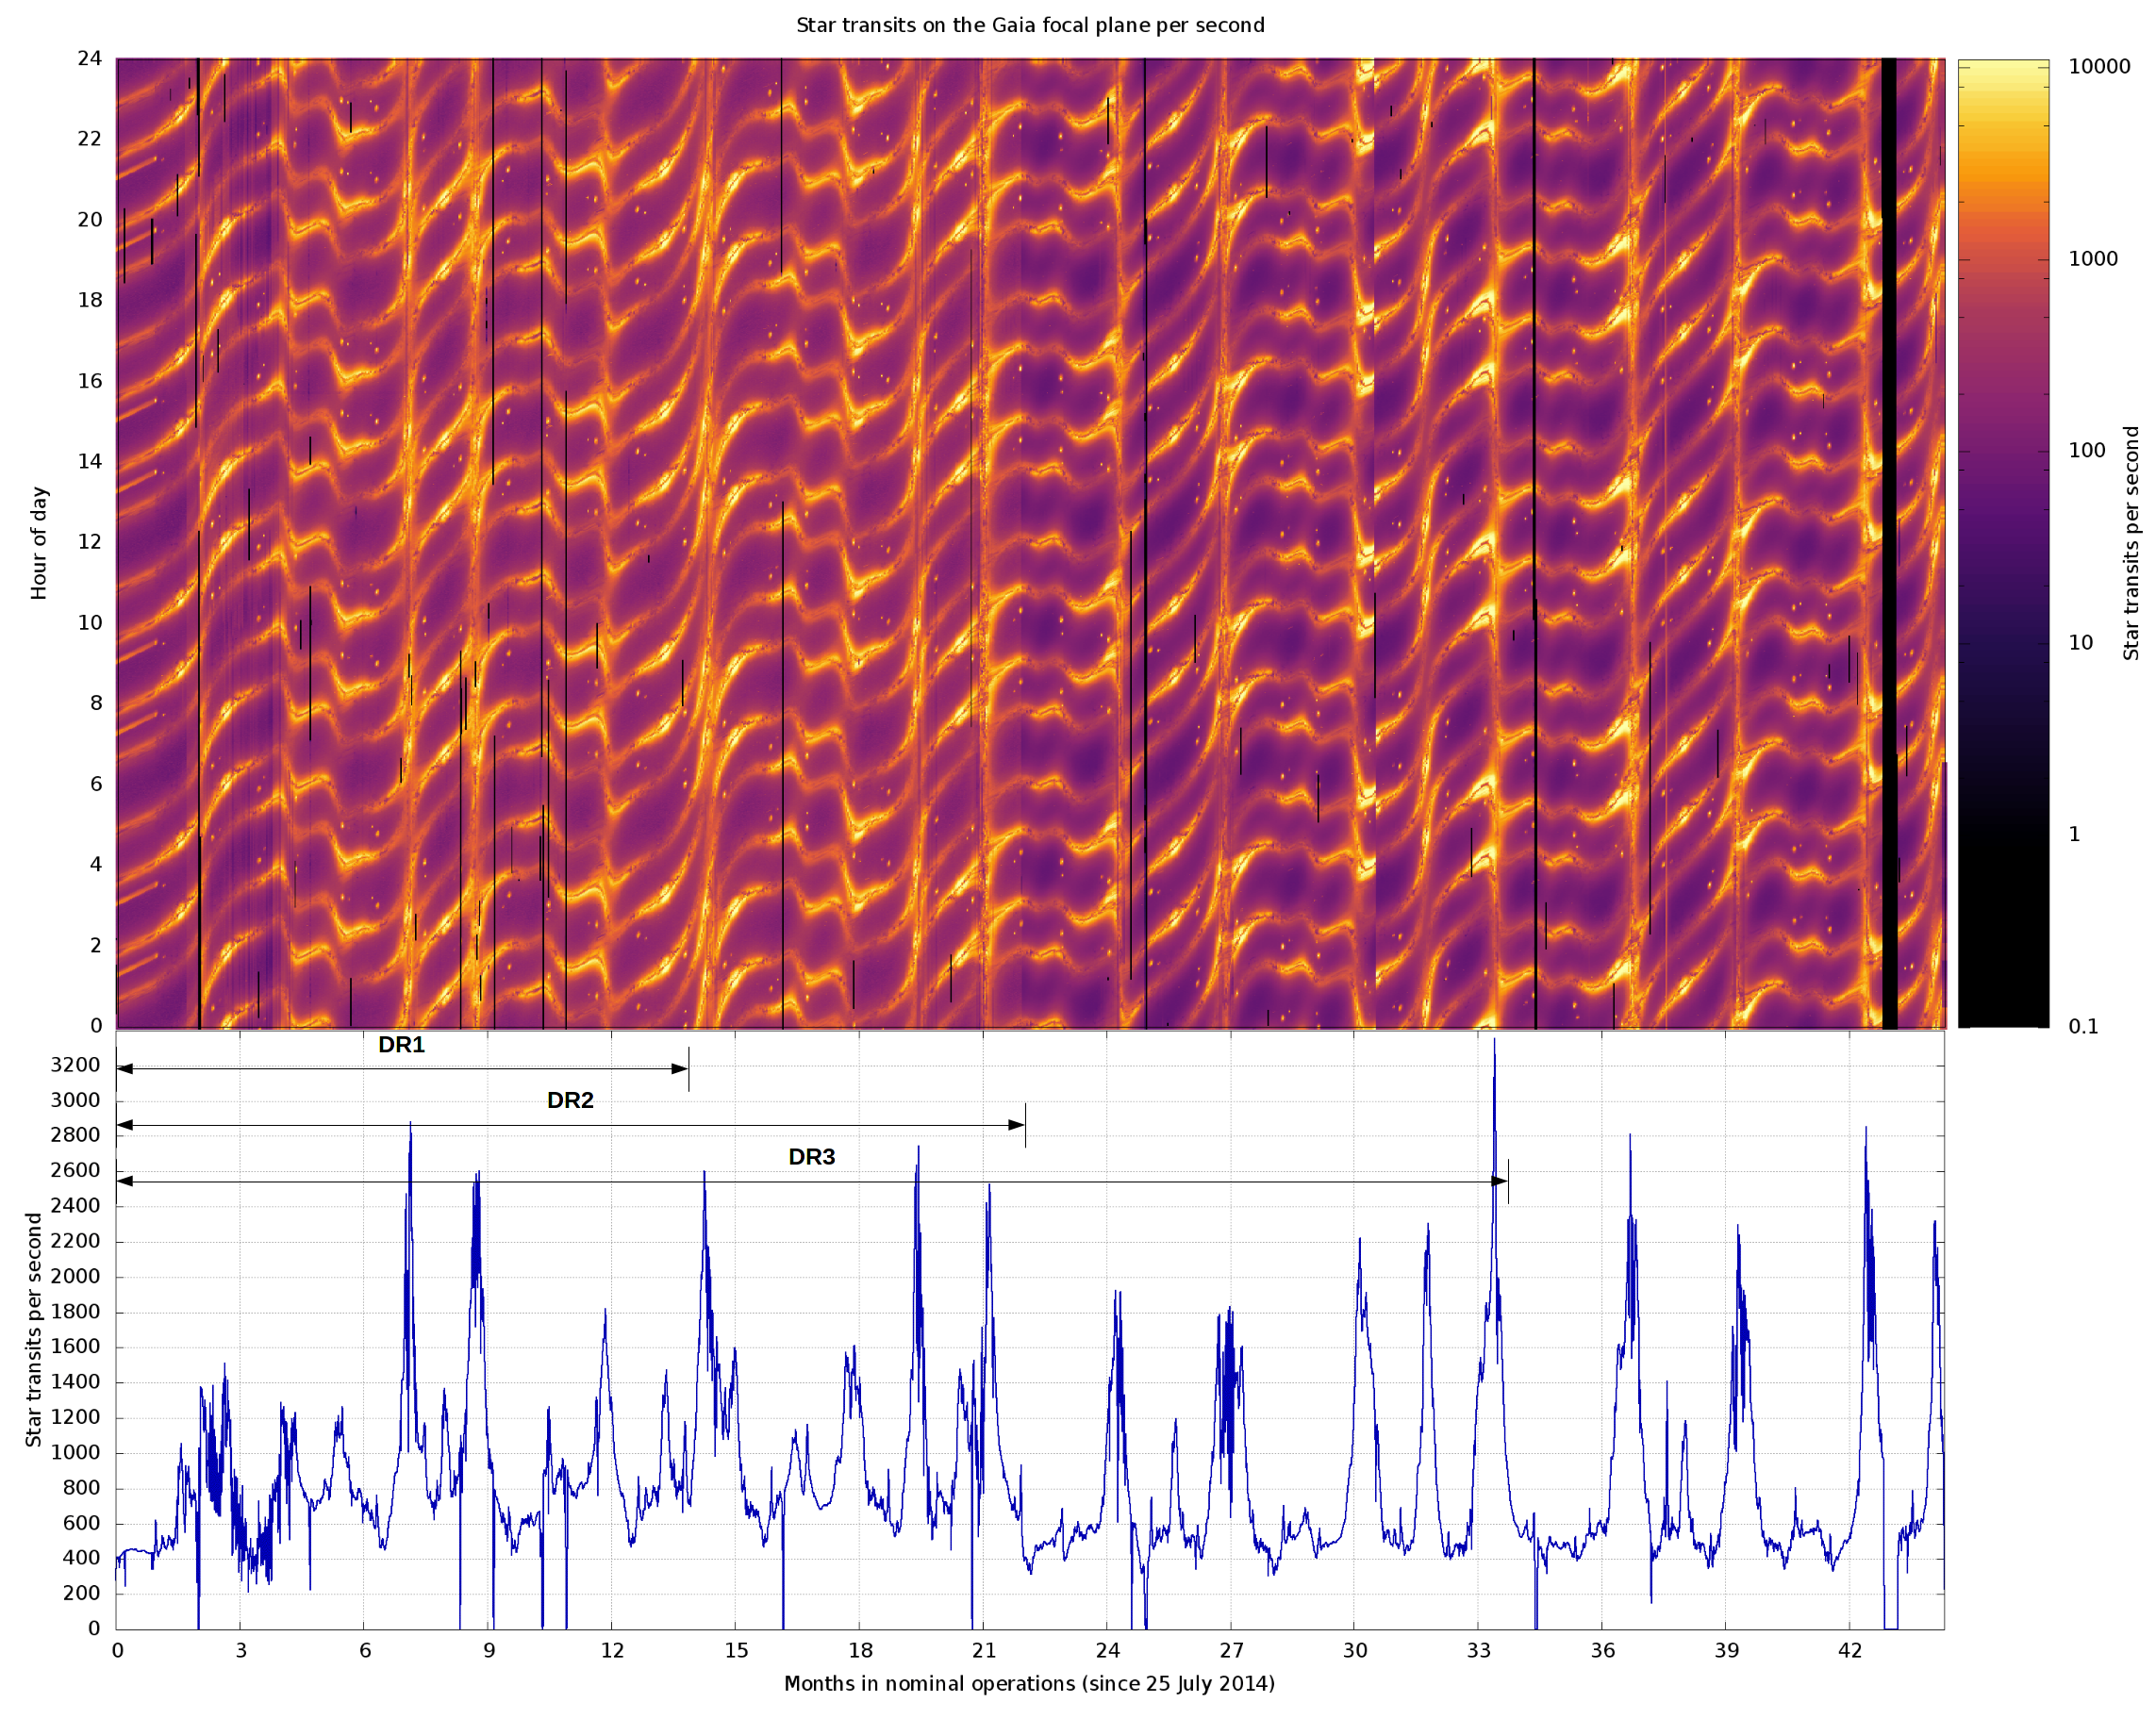
Figure 1: Illustration of the density of star transits during 3.7 years of Gaia nominal operations. The top panel shows a plot of time during one day (along the vertical axis) vs the date along the horizontal axis (in months since the start of the mission), colour coded by the variations of the number of star transits during a day, which reveals the observed scene. The bottom panel (a version of the top panel collapsed along the vertical axis) shows a simple time series with the long-term transit density variations, where the peaks reveal the periods where Gaia's telescopes scan along the Galactic plane. We have labelled the time ranges included in Gaia DR1, in the imminent DR2, and in the future DR3. The DR4 range extends beyond this plot.

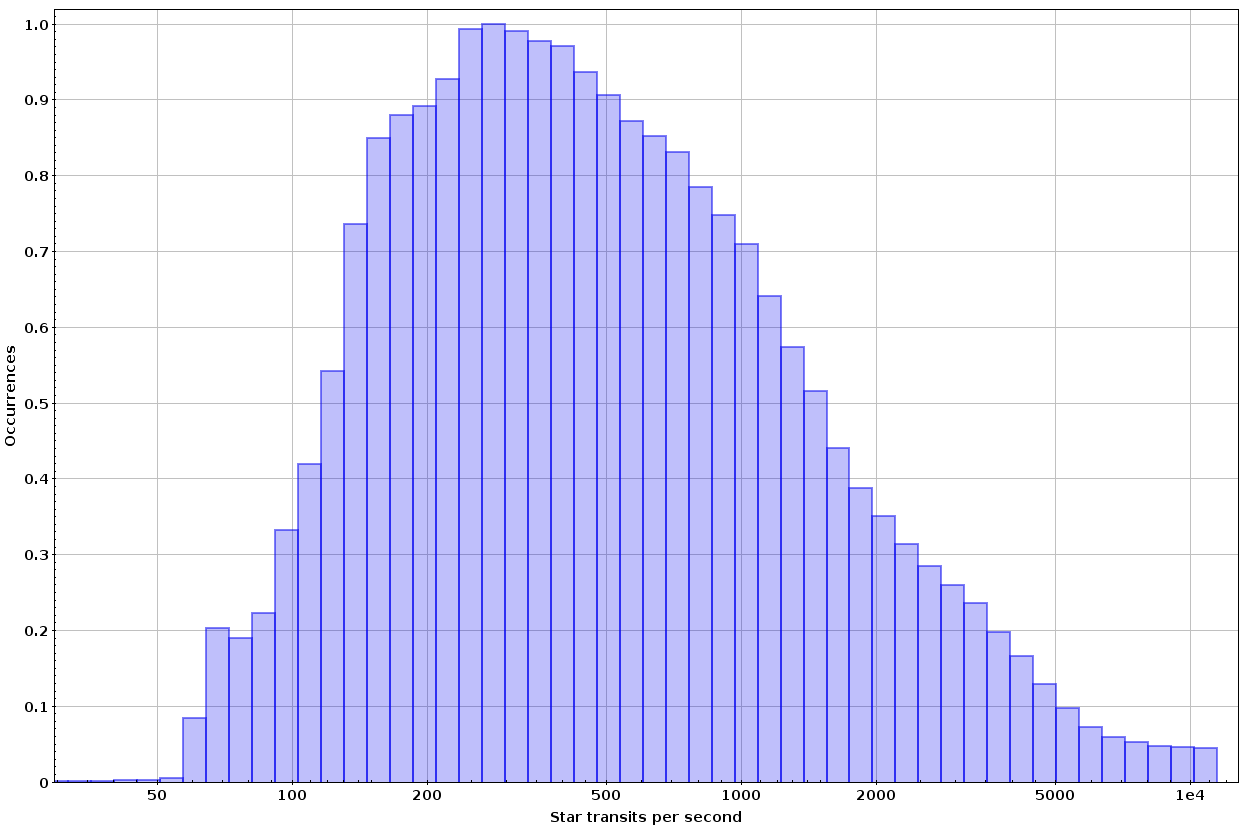
On 14 April 2018, about 10 days before the second Gaia Data Release, the spacecraft and daily data processing systems have reached yet another stunning milestone: the number of star transits has reached 100 billion!

The Gaia satellite has two telescopes pointing to two regions of the sky separated by 106.5 degrees. The satellite spins at a rate of 6 hours per revolution with the two telescopes scanning a great circle and the stars continuously transiting the focal plane. Every day, Gaia instruments record about 70 million transits. A full transit includes an observation in the sky mapper (to detect the objects in the sky), 9 observations for astrometry, 2 for spectrophotometry and 3 for radial velocity measurements (see a video explaining the measuring process here). Roughly speaking, each transit yields 10 individual observations for astrometry (counting the sky mapper). Therefore, the 100 billion individual transits mean 1 trillion (1000 billion) individual observations acquired.

There are obviously more transits than real, physical objects. As already anticipated, Gaia DR2 will contain "only" 1.7 billion sources, but each of them has been observed a number of times - that is, the features of each source have been determined from the data of several transits. We have estimated that each source will be observed, on average, in 70 transits during the nominal five-year mission, which means we should reach (and most probably exceed) 120 billion transits - that is, 1.7 billion sources times 70 transits. So far, in 3.7 years of nominal operations and considering 1.7 billion sources, Gaia has already observed each source more than 50 times on average.

As a consequence of the non-uniform density of sources in the sky, the number of objects transiting the focal plane varies very significantly with time. Figure 1 shows a time-time illustration of this fact. In the top panel, the horizontal axis is the day since the start of nominal operations (labelled in months), the vertical axis is the minute of the day (labelled in hours), and the colours indicate the average number of transits per second acquired during that day and minute. As said, the density of transits strongly varies with time, from just a few tens per second up to several thousands per second when Gaia observes from the emptiest areas of the sky to the densest areas of the Milky Way. This is also illustrated in the histogram shown in Figure 2.


Figure 2: Histogram of the star transits density, normalized to the maximum bin (which is at around 300 transits per second). It corresponds to the same set of transits shown in Figure 1. Excluding the idle times, just 4.1% of the time (55.3 days) Gaia has observed less than 100 star transits per second. Most of the time (44.2%) it has observed at least 500 star transits per second, exceeding 5000 transits/sec during 1.8% of the time (24.4 days).


The top panel of Figure 1 shows some interesting features. One can see black "gaps", which correspond to the times when the Gaia instruments were not acquiring data. Some are just calibration or on-board configuration activities, others are spacecraft manoeuvres, and others are "safe modes" - with the February 2018 event being the most remarkable one, easily seen towards the right end of the plot. Overall, Gaia instruments have been off during less than 1.7% of the time (with almost half of this time corresponding to the mentioned safe mode).

Apart from the gaps, changes in the way of scanning and changes in the way of working of the instruments are seen as sudden changes in the picture. The most remarkable feature of the plot is the observational pattern, which basically corresponds to the four revolutions per day and the two viewing directions. Each telescope crosses the Milky Way disc twice in each revolution producing a total of 16 crossings each day. These crossings are the narrow bright bands in the top panel of Figure 1. Every few months Gaia scans almost exactly along the Galactic plane, which is seen as the bands of the top panel getting steeper and also as peaks in the bottom panel.

In between the bands we also see two bright dots. These are the Magellanic Clouds, satellite galaxies to our own Galaxy. Like the Milky Way they are conspicuous objects even to the naked eye.


Figure 3: Zoom of Figure 1 (stretched four times horizontally) on an interesting time range (towards months 37-39), showing the galactic structure and also the Magellanic clouds. The vertical, bright line contains false detections during a massive Solar flare on 10th September 2017 sending a strong wind of protons towards Gaia.


The number of transits per second outlines the galactic structure, with the prominent enhanced density of the galactic disc and the bulge. It is better seen in the zoom shown in Figure 3, where we can even see the two Magellanic clouds. This zoomed figure better shows that Gaia crosses the galactic disc several times every day. In the zoomed image each of its two telescopes points towards the inner parts of the galactic plane four times a day, and towards the outer parts four more times a day.

Because of the precession of the spin axis around the Sun-Earth direction, the scanned great circle varies its inclination with respect to the galactic plane, and from time to time that great circle coincides with the plane. In these periods the number of transits reaches the maximum capacity available on board and some objects are not observed or their observations are not downloaded to the ground.

Maybe we can better understand the scale at which Gaia operates with the following equivalence: If we would like to observe each of the DR2 sources during just one second, we would need 54 years. Gaia has already observed each star during more than four seconds 500 times in less than four years. The accumulated exposure time exceeds 133 thousand years!

Gaia is now almost 45 months into its mission. The second Gaia data release, due on 25th April 2018, covers the first 22 months, so we have in fact already twice as much data at hand.

The nature of DPAC data processing requires to iterate several times over the data in order to achieve high accuracy in both calibrations and the results delivered with a Gaia data release. In order to facilitate intermediate data releases the amount of data processed is kept limited for the earlier releases with more and more data being added to the processing for each subsequent release. For Gaia DR3 DPAC will process about 34 months of data, while for Gaia DR4 it is planned to process the full five year set of raw data from the nominal mission.

Credits: ESA/Gaia/DPAC,  J. Portell, C. Jordi, C. Fabricius, J.Castañeda, P. Esquej, A.G.A. Brown

[Published: 14/04/2018]


Image of the Week Archive

2023

19/12: 10 Science topics to celebrate Gaia's 10 years in space

31/10: Gaia observes cosmic clock inside a heavenly jewel

10/10: Gaia Focused Product Release stories

27/09: Does the Milky Way contain less dark matter than previously thought?

22/09: Mass-luminosity relation from Gaia's binary stars

13/09: Gaia DPAC CU8 seminars

13/06: Gaia's multi-dimensional Milky Way

18/05: Mapping the Milky Way

15/05: Goonhilly station steps in to save Gaia science data

25/04: The Gaia ESA Archive

05/04: Dual quasar found to be hosted by an ongoing galaxy merger at redshift 2.17

21/03: GaiaVari: a citizen science project to help Gaia variability classificaton

09/02: Missing mass in Albireo Ac: massive star or black hole?

31/01: Gaia reaches to the clouds – 3D kinematics of the LMC

25/01: Meet your neighbours: CNS5 - the fifth catalogue of nearby stars

18/01: A single-object visualisation tool for Gaia objects

2022

25/11: 100 months of Gaia data

23/11: The astonishment

09/11: Gamma-Ray Burst detection from Lagrange 2 point by Gaia

04/11: Gaia's first black hole discovery: Gaia BH1

26/10: Are Newton and Einstein in error after all?

21/10: Gaia ESA Archive goes live with third data release

06/10: Mapping the interstellar medium using the Gaia RVS spectra

26/09: Gaia on the hunt for dual quasars and gravitational lenses

23/09: Gaia's observation of relativistic deflection of light close to Jupiter

13/06: Gaia Data Release 3

10/06: MK classification of stars from BP/RP spectrophotometry across the Hertzsprung-Russell diagram

09/06: BP/RP low-resolution spectroscopy across the Hertzsprung-Russell diagram

27/05: Cepheids and their radial velocity curves

23/05: The Galaxy in your preferred colours

19/05: GaiaXPy 1.0.0 released, a tool for Gaia's BP/RP spectra users

11/05: Systemic proper motions of 73 galaxies in the Local group

28/03: Gaia query statistics

16/03: Gaia's first photo shooting of the James Webb Space Telescope

08/03: Gaia's women in science - coordination unit 8

25/02: Not only distances: what Gaia DR3 RR Lyrae stars will tell us about our Galaxy and beyond

11/02: Gaia's women in science

31/01: Astrometric orbit of the exoplanet-host star HD81040

12/01: The Local Bubble - source of our nearby stars

05/01: A Milky-Way relic of the formation of the Universe

2021

23/12: Signal-to-Noise ratio for Gaia DR3 BP/RP mean spectra

22/12: The 7 October 2021 stellar occultation by the Neptunian system

01/12: Observation of a long-predicted new type of binary star

24/09: Astrometric microlensing effect in the Gaia16aye event

22/09: the power of the third dimension - the discovery of a gigantic cavity in space

16/09: An alternative Gaia sky chart

25/08: Gaia Photometric Science Alerts and Gravitational Wave Triggers

09/07: How Gaia unveils what stars are made of

23/06: Interviews with CU3

27/04: HIP 70674 Orbital solution resulting from Gaia DR3 processing

30/03: First transiting exoplanet by Gaia

26/03: Apophis' Yarkovsky acceleration improved through stellar occultation

26/02: Matching observations to sources for Gaia DR4

2020

22/12: QSO emission lines in low-resolution BP/RP spectra

03/12: Gaia Early Data Release 3

29/10: Gaia EDR3 passbands

15/10: Star clusters are only the tip of the iceberg

04/09: Discovery of a year long superoutburst in a white dwarf binary

12/08: First calibrated XP spectra

22/07: Gaia and the size of the Solar System

16/07: Testing CDM and geometry-driven Milky Way rotation Curve Models

30/06: Gaia's impact on Solar system science

14/05: Machine-learning techniques reveal hundreds of open clusters in Gaia data

20/03: The chemical trace of Galactic stellar populations as seen by Gaia

09/01: Discovery of a new star cluster: Price-Whelan1

08/01: Largest ever seen gaseous structure in our Galaxy

2019
20/12: The lost stars of the Hyades
06/12: Do we see a dark-matter like effect in globular clusters?
12/11: Hypervelocity star ejected from a supermassive black hole
17/09: Instrument Development Award
08/08: 30th anniversary of Hipparcos
17/07: Whitehead Eclipse Avoidance Manoeuvre
28/06: Following up on Gaia Solar System Objects
19/06: News from the Gaia Archive
29/05: Spectroscopic variability of emission lines stars with Gaia
24/05: Evidence of new magnetic transitions in late-type stars
03/05: Atmospheric dynamics of AGB stars revealed by Gaia
25/04: Geographic contributions to DPAC
22/04: omega Centauri's lost stars
18/04: 53rd ESLAB symposium "the Gaia universe"
18/02: A river of stars
2018
21/12: Sonification of Gaia data
18/12: Gaia captures a rare FU Ori outburst
12/12: Changes in the DPAC Executive
26/11:New Very Low Mass dwarfs in Gaia data
19/11: Hypervelocity White Dwarfs in Gaia data
15/11: Hunting evolved carbon stars with Gaia RP spectra
13/11: Gaia catches the movement of the tiny galaxies surrounding the Milky Way
06/11: Secrets of the "wild duck" cluster revealed
12/10: 25 years since the initial GAIA proposal
09/10: 3rd Gaia DPAC Consortium Meeting
30/09: A new panoramic sky map of the Milky Way's Stellar Streams
25/09: Plausible home stars for interstellar object 'Oumuamua
11/09: Impressions from the IAU General Assembly
30/06: Asteroids in Gaia Data
14/06: Mapping and visualising Gaia DR2

25/04: In-depth stories on Gaia DR2

14/04: Gaia tops one trillion observations
16/03: Gaia DR2 Passbands
27/02: Triton observation campaign
11/02: Gaia Women In Science
29/01: Following-up on Gaia
2017
19/12: 4th launch anniversary
24/11: Gaia-GOSA service
27/10: German Gaia stamp in the making
19/10: Hertzsprung-russell diagram using Gaia DR1
05/10: Updated prediction to the Triton occultation campaign
04/10: 1:1 Gaia model arrives at ESAC
31/08: Close stellar encounters from the first Gaia data release
16/08: Preliminary view of the Gaia sky in colour
07/07: Chariklo stellar occultation follow-up
24/04: Gaia reveals the composition of asteroids
20/04: Extra-galactic observations with Gaia
10/04: How faint are the faintest Gaia stars?
24/03: Pulsating stars to study Galactic structures
09/02: Known exoplanetary transits in Gaia data
31/01: Successful second DPAC Consortium Meeting
2016
23/12: Interactive and statistical visualisation of Gaia DR1 with vaex
16/12: Standard uncertainties for the photometric data (in GDR1)
25/11: Signature of the rotation of the galactic bar uncovered
15/11: Successful first DR1 Workshop
27/10: Microlensing Follow-Up
21/10: Asteroid Occultation
16/09: First DR1 results
14/09: Pluto Stellar Occultation
15/06: Happy Birthday, DPAC!
10/06: 1000th run of the Initial Data Treatment system
04/05: Complementing Gaia observations of the densest sky regions
22/04: A window to Gaia - the focal plane
05/04: Hipparcos interactive data access tool
24/03: Gaia spots a sunspot
29/02: Gaia sees exploding stars next door
11/02: A new heart for the Gaia Object Generator
04/02: Searching for solar siblings with Gaia
28/01: Globular cluster colour-magnitude diagrams
21/01: Gaia resolving power estimated with Pluto and Charon
12/01: 100th First-Look Weekly Report
06/01: Gaia intersects a Perseid meteoroid
2015
18/12: Tales of two clusters retold by Gaia
11/11: Lunar transit temperature plots
06/11: Gaia's sensors scan a lunar transit
03/11: Celebrity comet spotted among Gaia's stars
09/10: The SB2 stars as seen by Gaia's RVS
02/10: The colour of Gaia's eyes
24/09: Estimating distances from parallaxes
18/09: Gaia orbit reconstruction
31/07: Asteroids all around
17/07: Gaia satellite and amateur astronomers spot one in a billion star
03/07: Counting stars with Gaia
01/07: Avionics Model test bench arrives at ESOC
28/05: Short period/faint magnitude Cepheids in the Large Magellanic Cloud
19/05: Visualising Gaia Photometric Science Alerts
09/04: Gaia honours Einstein by observing his cross
02/04: 1 April - First Look Scientists play practical joke
05/03: RR Lyrae stars in the Large Magellanic Cloud as seen by Gaia
26/02: First Gaia BP/RP deblended spectra
19/02: 13 months of GBOT Gaia observations
12/02: Added Value Interface Portal for Gaia
04/02: Gaia's potential for the discovery of circumbinary planets
26/01: DIBs in three hot stars as seen by Gaia's RVS
15/01: The Tycho-Gaia Astrometric Solution
06/01: Close encounters of the stellar kind
2014
12/12: Gaia detects microlensing event
05/12: Cat's Eye Nebula as seen by Gaia
01/12: BFOSC observation of Gaia at L2
24/11: Gaia spectra of six stars
13/11: Omega Centauri as seen by Gaia
02/10: RVS Data Processing
12/09: Gaia discovers first supernova
04/08: Gaia flag arrives at ESAC
29/07: Gaia handover
15/07: Eclipsing binaries
03/07: Asteroids at the "photo finish"
19/06: Calibration image III - Messier 51
05/06: First Gaia BP/RP and RVS spectra
02/06: Sky coverage of Gaia during commissioning
03/04: Gaia source detection
21/02: Sky-background false detections in the sky mapper
14/02: Gaia calibration images II
06/02: Gaia calibration image I
28/01: Gaia telescope light path
17/01: First star shines for Gaia
14/01: Radiation Campaign #4
06/01: Asteroid detection by Gaia
2013
17/12: Gaia in the gantry
12/12: The sky in G magnitude
05/12: Pre-launch release of spectrophotometric standard stars
28/11: From one to one billion pixels
21/11: The Hipparcos all-sky map
15/10: Gaia Sunshield Deployment Test
08/10: Initial Gaia Source List
17/09: CU1 Operations Workshop
11/09: Apsis
26/08: Gaia arrival in French Guiana
20/08: Gaia cartoons
11/07: Model Soyuz Fregat video
01/07: Acoustic Testing
21/06: SOVT
03/06: CU4 meeting #15
04/04: DPCC (CNES) 
26/03: Gaia artist impression 
11/02: Gaia payload testing  
04/01: Space flyby with Gaia-like data
2012
10/12: DPAC OR#2. Testing with Planck
05/11: Galaxy detection with Gaia
09/10: Plot of part of the GUMS-10 catalogue
23/07: "Gaia" meets at Gaia
29/06: The Sky as seen by Gaia
31/05: Panorama of BAM clean room
29/03: GREAT school results
12/03: Scanning-law movie
21/02: Astrometric microlensing and Gaia
03/02: BAM with PMTS
12/01: FPA with all the CCDs and WFSs
2011
14/12: Deployable sunshield
10/11: Earth Trojan search
21/10: First Soyuz liftoff from the French Guiana
20/09: Fast 2D image reconstruction algorithm
05/09: RVS OMA
10/08: 3D distribution of the Gaia catalogue
13/07: Dynamical Attitude Model
22/06: Gaia's view of open clusters
27/05: Accuracy of the stellar transverse velocity
13/05: Vibration test of BAM mirrors
18/04: L. Lindegren, Dr. Honoris Causa of the Observatory of Paris
19/01: Detectability of stars close to Jupiter
05/01: Delivery of the WFS flight models
2010
21/12: The 100th member of CU3
17/11: Nano-JASMINE and AGIS
27/10: Eclipsing binary light curves fitted with DPAC code
13/10: Gaia broad band photometry
28/09: Measuring stellar parameters and interstellar extinction
14/09: M1 mirror
27/08: Quest for the Sun's siblings
 
Please note: Entries from the period 2003-2010 are available in this PDF document.